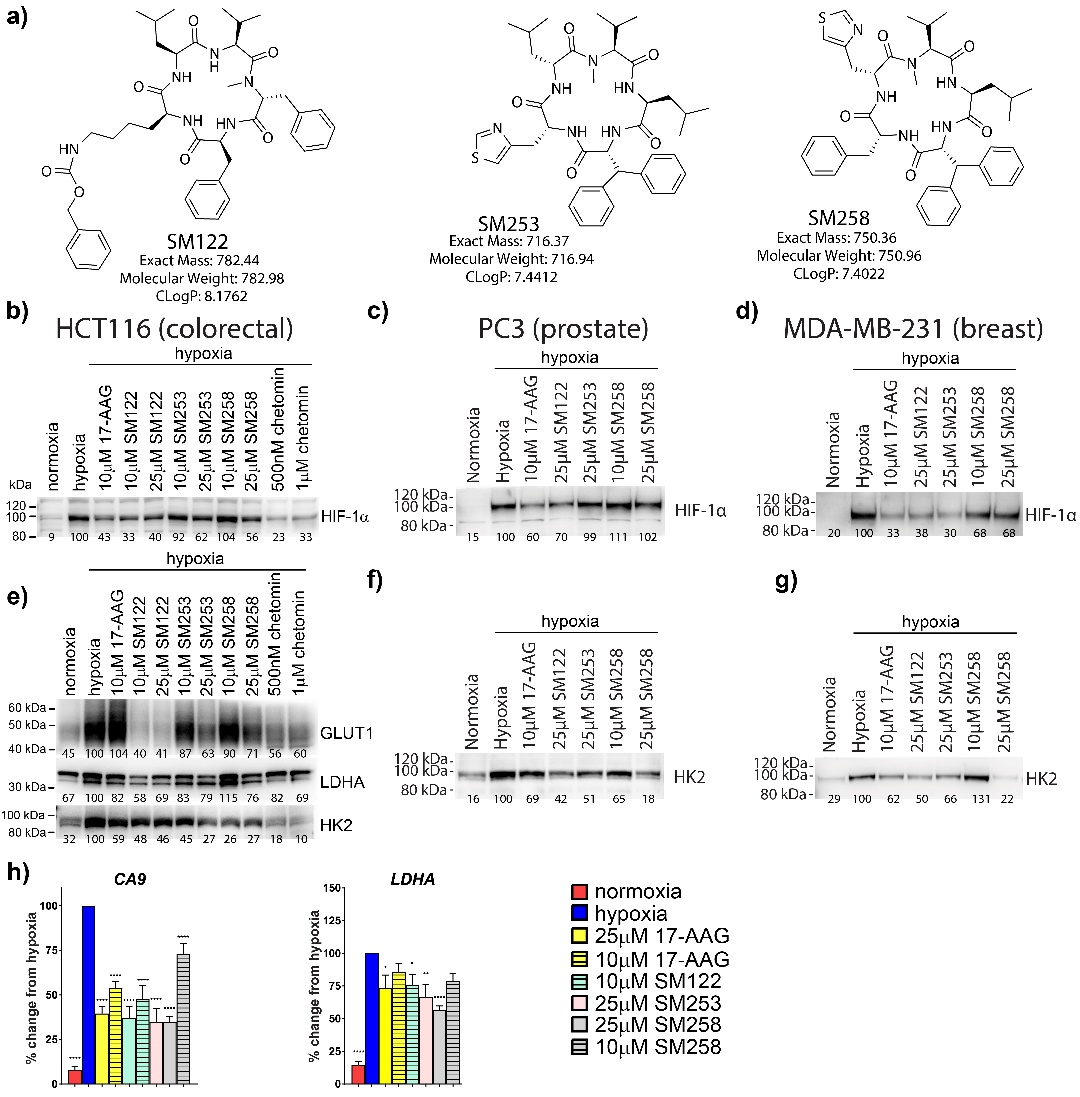
Fig. 1. C-terminal HSP90 inhibitors, SM compounds, inhibit HIF-1α stabilization under hypoxia and decrease HIF-1 target gene expression in cancer cells. a) Chemical structures of SM122, SM253 and SM258. b) HCT116, (c) PC3 or (d) MDA-MB-231 cells were treated with SM compounds and exposed to hypoxia for 6 hrs prior to making nuclear cell lysates for western blotting. e) HCT116 cells were incubated ± SM compounds or 17-AAG in hypoxia for 18 hrs. Total protein was isolated, run on SDS-PAGE and transferred to western blot to assess expression of the HIF target genes, GLUT1, LDHA and HK2. f) Western blot of HK2 expression following treatment of PC3 cells with HSP90 inhibitors. g) Western blot of HK2 expression following treatment of MDA-MB-231 cells with HSP90 inhibitors. Representative blots shown with densitometry measured using digital imaging and BioRad ImageLab software. The numbers shown below blots are the direct densitometric measurements. The hypoxic control is normalized to 100 in each blot. Each blot was n ≥ 3. h) mRNA expression of HIF-1 target genes CA9 and LDHA. HCT116 cells were incubated ± SM compounds or 17-AAG in hypoxia for 18 hours. Total RNA was isolated, converted to cDNA and used for qPCR measurement (calculated using the ΔΔCt method). Results expressed as % of hypoxic control. Mean ± SEM of independent experiments run in duplicate (n ≥ 3). Statistical analysis conducted using an ordinary one-way ANOVA with multiple comparisons to hypoxia in Graphpad Prism. * = p <0.05, ** = p <0.01, *** = p <0.001 and **** = p <0.0001. Histone H3 loading controls for Figs. 1b-1g are located in the online supplemental material (see www.cellphysiolbiochem.com).